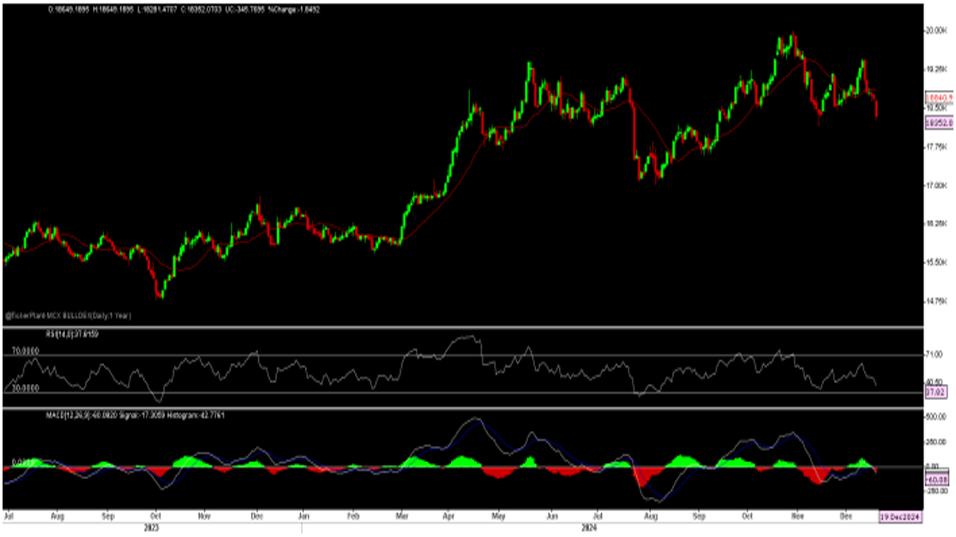
Date: September 16, 2024

Daily Technical Outlook

Listen to this newsletter    

Metals and Energy

Bullions Index
Online share trading app

The Benchmark index witnessed a Gap Up Opening on 13/9/24 and remain on sideways to higher side through out the day in expectations that FED likely to adopt larger than expected rate cut in next meeting which fall in dollar index and sharp rally seen in bullion which all resulted in index close near days high and well above over previous day close.

Now, Index has Support at 18200 – 17650, as long hold, more Upside expected towards 18600-19000 in short term. Other side only Sustain below 17650 seen again 17100-17000 in days to come.

Price is trading above short term 13-days SMA and RSI at 64 mark with upward slope indicates more room for Upside in the counter. Other side below above zero line MACD seen buying seaport at every dip.

Metal Index

Open free demat account

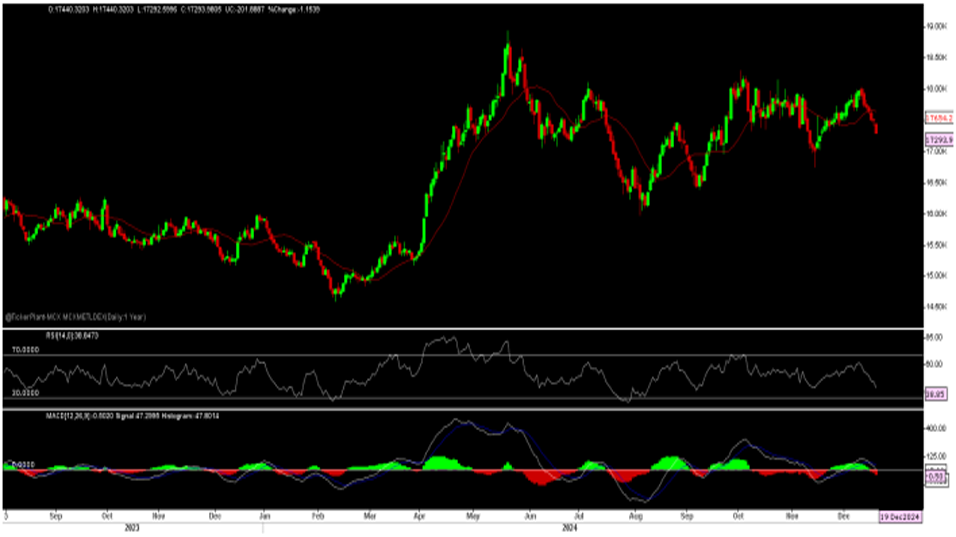
The Benchmark index seen a Gap Up Opening on 13/9/24 and remain on higher side through out the day as fall in dollar index and demand hope from top metals consumer China after market expectations that China might cut rates for mortgage to support economy, positive for base metals packupports metals and which all resulted in index close near days high and well above over previous day closing.

Now index has a Support at 16950-750-500-400, as long hold, more Upside expected towards 17300-17500-18200 in medium term. While on lower side only sustain below 16400 seen 16100-16000 again in days to come.

Price is trading below short term 13 SMA while RSI at 56-marks with Downward slope indicates mix of the view in the counter. Other side below zero line MACD indicates selling pressure at every rally in the counter.

Technical Levels

Commodity Contract Month CLOSE S1 S2 R1 R2 Trend
BULLIONS(Rs.)
Gold M Oct 73367 73100 72700 73500 73800 BULLISH
Silver M Nov. 89072 88600 87600 89700 90500 BULLISH
Energy
Crude Oil Sep. 5770 5750 5680 5850 5910 SIDEWAYS
Natural Gas Sep. 193.90 193 187 203 210 SIDEWAYS
BASEMETALS
Copper Sep. 892.20 793.0 785 804 815 SIDEWAYS
Zinc Sep. 267.90 265.5 263.0 268.60 270.0 BULLISH
Lead Sep. 185.35 182 180 187 190 SIDEWAYS
Nickel Sep. 1386.40 1300 1250 1400 1450 SIDEWAYS

Agri Morning Buzz

Commodity (NCDX/MCX) Downside Target Stop loss (for sell trade) Sell below Buy above Stop loss (for Buy trade) Upside Target
GUARGUM (Oct) 10300-10100 10700 10600 10700 10600 10900-11000
JEERAUNJHA (Oct) 24800-24500 25400 25300 26000 25900 26500-26700
COCUDAKL (Dec) 2990-2970 3030 3050 3090 3070 3130-3150
CASTOR (Oct) 5900-5800 6200 6100 6250 6150 6500-6600
TURMERIC (Oct) 13000-12900 13400 13300 14150 14050 14400-14500

Derivative Report

Nifty

  • September future on Friday close at 25372.6 on a positive note with -0.86% decrease in OI and with a price increase of 0.06% (16.3) indicating Short Covering. (SC)
  • During the week Nifty made a high of 25433 and low of 24816 and settled at 25372.6.
  • Annualized volatility index VIX has decreased from 14.23% to 12.55% down by -11.80%.

Bank Nifty

  • September future on Friday close at 51929.4 on a positive note with 3.05% increase in OI with a price increase of 0.33% (170.2) indicating Long Buildup. (SB)
  • During the week BNF made a high of 52044 and low of 50255.55 and settled at 51929.40.
  • Bank Nifty IV has decreased from 15.3% to 13.7% decreased by -10.45%
Open free demat account
  • PCR OI during the week has made a high of 1.17 & low of 0.60 and close on weekly basis at 1.09 levels compared to 0.61 of last week.
  • PCR OI currently is at 1.09 level which is above the median line of 0.79 and shows a tug of war between Put and Call Writers.
Online share trading app
  • Option build-up shows that Nifty has Support at 25300 followed by 25200 and Resistance is placed at 25400 followed by 25350.
  • The pivot level for Nifty is placed at 24900.
Online share trading app
  • VIX started the week with a low volatility of 14.06 gradually moving towards a low of 12.55 and closing at 12.55.
  • The decrease in VIX indicates decrease in volatility.
  • VIX trading near 12.55 can lead a move towards 11, whereas VIX trading above 15 can lead a move towards 18.
  • We expect the volatility to trade between 11-18 level.
Online share trading app
  • The Nifty Futures started the week with an open interest (OI) of 15,128,450 contracts, with short positions being squared off.
  • During the week, a total of 31,349,725 short contracts were covered.
  • The recent rise in the Nifty Index is primarily due to this short covering.
Online share trading app
  • In previous week FII’s Total Number of contracts in INDEX FUTURE conclude at 601115 compared to 550850 contract adding 50265.
  • The total open interest position of FII’s in Index future is at 601115 which on weekly basis has increased by 9.12%.
  • During this period, the highest LS Ratio was 2.06 and the lowest was 1.74.
Online share trading app
  • In previous week FII’s no of contract in Stock Future conclude at 4212030 compared to 4161927 contract.
  • The total FII’s OI in stock future is at 4212030 which on weekly basis has increased by 1.2%

Weekly Long Build-up

Script Price (%) OI (%)
DIVISLAB 5.34% 39.48%
CANFINHOME 7.03% 21.96%
PAGEIND 7.36% 17.21%
AUROPHARMA 3.08% 13.28%
INDIAMART 2.75% 13.13%

Weekly Short Build-up

Script Price (%) OI (%)
GRANULES -16.85% 102.29%
AARTIIND -4.03% 20.85%
ATUL -0.11% 20.25%
RECLTD -4.05% 17.72%
TATAMOTORS -4.98% 17.54%

Weekly Short Covering

Script Price (%) OI (%)
AXISBANK 3.76% -11.53%
MFSL 1.21% -10.62%
ABFRL 5.02% -10.62%
DIXON 5.18% -10.01%
AUBANK 0.88% -9.66%

Weekly Short Covering

Script Price (%) OI (%)
DABUR -0.38% -5.72%
VEDL -1.42% -5.61%
JKCEMENT -0.78% -4.26%
ICICIPRULI -0.37% -4.23%
IOC -1.50% -3.43%
Online share trading app

BNF STOCKS CHG IN OI

Online share trading app

OTHER INDEX

SECTOR 09th Sep 13th Sep PRICE CHG 09th Sep 13th Sep OI CHG
FIN NIFTY 23788.95 23978.45 0.80% 123750 74550 -39.76%
MID NIFTY 13055.45 13355.2 2.30% 2249900 2299450 2.20%
NIFTY NXT 50 74561.75 75502.1 1.26% 15070 15860 5.24%
  • Short Covering is observed in Fin Nifty.
  • Long Build-up is observed in Mid Nifty.
  • Long Build-up is observed in Nifty Next 50.

Online share trading app

Download Bigul Trading App!

Supercharge your trading on the go with the Bigul Trading App! Download now for instant access to cutting-edge features, real-time insights, and unparalleled convenience.

FAQs

Discover all you need to know effortlessly with our frequently asked questions—your go-to resource for answers.

Daily market outlook is a detailed statistical collection of reports of market behavior updated on a daily basis on various sectors i.e. forex, indices, agri-commodity, metals & energy. You will be getting daily technical outlook as well as Market mood and an audio which will explain everything in detail.

Yes, all the reports get updated on a daily basis as we offer and updated reports so that, you can make corrective investment decisions on time.

Yes, in addition to written analysis, we offer audio insights where key market points are discussed.

No, we offer these reports free of cost to everyone.

Market mood refers to the overall sentiment or psychology of traders and investors in the market. Our reports assess market mood to gauge sentiment and potential market direction.

Absolutely. Our reports provide an in-depth analysis of agricultural commodities, highlighting key trends, price movements, and factors influencing the market.

It is important to stay updated in the market to make the correct investment decisions , as market outlook reports will be beneficial for individuals who are making future investment decisions.

Our experts use a variety of technical analysis techniques, including chart patterns, indicators, and statistical models, to provide insights into market trends and potential price movements.

Subscribe now to get
latest market updates

Close

Let's Open Free Demat Account